57 Research, Evaluation, and Social Work Practice
Alexandria Lewis

Image Attribution: UnSplash (public use)
Content Outline, Competency, and KSAs
II. Assessment and Intervention Planning
IIB. Assessment Methods and Techniques
KSAs:
– Basic and applied research design and methods.
– Data collection and analysis methods.
– Methods to assess reliability and validity in social work research.
IIIA. Intervention Processes and Techniques for Use Across Systems
-Evidence-based practice.
– Case recording for practice evaluation or supervision
IIIB. Intervention Processes and Techniques for Use With Larger Systems
– The effects of program evaluation findings on services.
– Methods to evaluate agency programs (e.g., needs assessment, formative/summative assessment, cost effectiveness, cost-benefit analysis, outcomes assessment).
IVA. Professional Values and Ethical Issues
– Research ethics (e.g., institutional review boards, use of human subjects, informed consent).
NASW Code of Ethics 5.02 Evaluation and Research
“(a) Social workers should monitor and evaluate policies, the implementation of programs, and practice interventions.
(b) Social workers should promote and facilitate evaluation and research to contribute to the development of knowledge.
(c) Social workers should critically examine and keep current with emerging knowledge relevant to social work and fully use evaluation and research evidence in their professional practice.
(d) Social workers engaged in evaluation or research should carefully consider possible consequences and should follow guidelines developed for the protection of evaluation and research participants. Appropriate institutional review boards should be consulted.
(e) Social workers engaged in evaluation or research should obtain voluntary and written informed consent from participants, when appropriate, without any implied or actual deprivation or penalty for refusal to participate; without undue inducement to participate; and with due regard for participants’ well-being, privacy, and dignity. Informed consent should include information about the nature, extent, and duration of the participation requested and disclosure of the risks and benefits of participation in the research.
(f) When using electronic technology to facilitate evaluation or research, social workers should ensure that participants provide informed consent for the use of such technology. Social workers should assess whether participants are able to use the technology and, when appropriate, offer reasonable alternatives to participate in the evaluation or research.
(g) When evaluation or research participants are incapable of giving informed consent, social workers should provide an appropriate explanation to the participants, obtain the participants’ assent to the extent they are able, and obtain written consent from an appropriate proxy.
(h) Social workers should never design or conduct evaluation or research that does not use consent procedures, such as certain forms of naturalistic observation and archival research, unless rigorous and responsible review of the research has found it to be justified because of its prospective scientific, educational, or applied value and unless equally effective alternative procedures that do not involve waiver of consent are not feasible.
(i) Social workers should inform participants of their right to withdraw from evaluation and research at any time without penalty.
(j) Social workers should take appropriate steps to ensure that participants in evaluation and research have access to appropriate supportive services.
(k) Social workers engaged in evaluation or research should protect participants from unwarranted physical or mental distress, harm, danger, or deprivation.
(l) Social workers engaged in the evaluation of services should discuss collected information only for professional purposes and only with people professionally concerned with this information.
(m) Social workers engaged in evaluation or research should ensure the anonymity or confidentiality of participants and of the data obtained from them. Social workers should inform participants of any limits of confidentiality, the measures that will be taken to ensure confidentiality, and when any records containing research data will be destroyed.
(n) Social workers who report evaluation and research results should protect participants’ confidentiality by omitting identifying information unless proper consent has been obtained authorizing disclosure.
(o) Social workers should report evaluation and research findings accurately. They should not fabricate or falsify results and should take steps to correct any errors later found in published data using standard publication methods.
(p) Social workers engaged in evaluation or research should be alert to and avoid conflicts of interest and dual relationships with participants, should inform participants when a real or potential conflict of interest arises, and should take steps to resolve the issue in a manner that makes participants’ interests primary.
(q) Social workers should educate themselves, their students, and their colleagues about responsible research practices” (Source: NASW Code of Ethics).
research overview
General Research Highlights
General Research Design Steps (not necessarily linear but can be viewed as circular):
- Select a research problem.
- Conduct a literature review.
- Develop research questions or hypotheses.
- Examine the data needed and how to collect the data.
- Determine data analysis (i.e., how you will analyze the data).
Types of Research:
- Descriptive: Describes or defines a particular phenomenon.
- “What percentage of clients drop out of services within 3 sessions?”
- Explanatory: Explains why particular phenomena work in the way they do; answers ‘why’ questions.
- “Does trauma history predict relapse in substance use recovery?”
- Exploratory: Conducted during the early stages of a project, usually when a researcher wants to test the feasibility of conducting a more extensive study.
- “How do youth in foster care describe their transition to adulthood?”
Types of Experimental Research:
- True Experimental- Some elements of a true experimental research study include randomization, control vs. experimental group, hypothesis, independent variable, and dependent variable.
- Quasi-experimental- Similar to experimental research, but there is no random assignment. Example: Nonequivalent groups and pretest-posttest design.
- Pre-experimental- Typically, this type of experimental research is utilized before a researcher decides to conduct a true experiment. An example of a pre-experimental design is a one-group pretest post-test.
| Design Type | Key Features | Example | Strengths | Limitations |
|---|---|---|---|---|
| True Experimental | – Random assignment- Control & experimental groups- Independent & dependent variables | Testing a new CBT group intervention vs. standard care with randomly assigned clients | High internal validity; controls for confounding variables | May lack real-world applicability; ethical/practical limits |
| Quasi-Experimental | – No random assignment- May have comparison/control group- Structured intervention | Comparing outcomes of a school program implemented in one grade but not another | More practical for field settings; allows for real-world study | Lower internal validity; risk of selection bias or confounders |
| Pre-Experimental | – No randomization- No control group- Often uses pretest-posttest format | Evaluating client mood changes before and after a single-group art therapy session | Simple and low-cost; good for pilot studies | Weakest validity; caannot rule out alternative explanations |
Key Takeaways (DeCarlo, 2018)
- Quasi-experimental designs do not use random assignment.
- Comparison groups are often used in quasi-experiments.
- Matching can improve the comparability of experimental and comparison groups.
- Quasi-experimental designs and pre-experimental designs are often used when experimental designs are impractical.
- Quasi-experimental and pre-experimental designs may be easier to carry out, but they lack the rigor of true experiments.
single-subject design
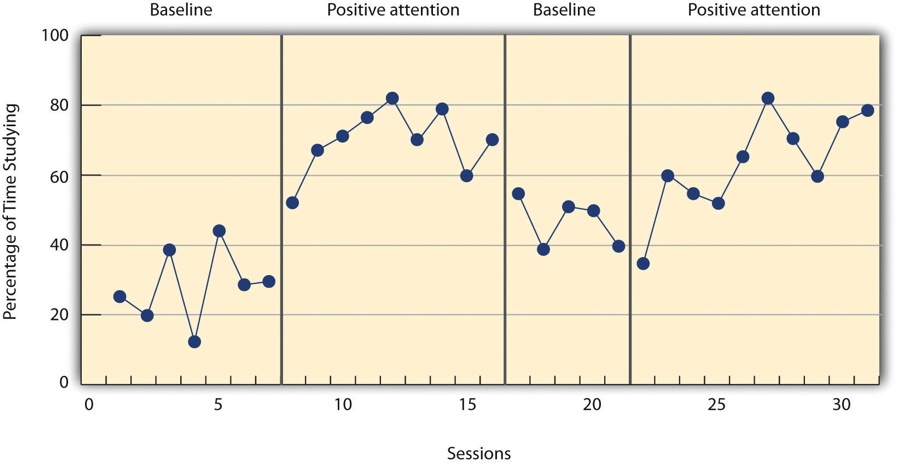
Single-subject research can be conducted with one client, an agency, a group, or a community. Single-subject research is considered a type of quantitative research. The goal is to examine whether an intervention is helping clients. The client system in single-subject research is their own control; there is no comparison group like in true experimental research. Examples of single-subject research include a single-case study or a pre- and post-test. Single-subject research design includes two primary phases: Baseline (A) and Treatment (B). There are different types: AB, ABA, and ABAB.
ABA and ABAB are sometimes referred to as a reversal or withdrawal design. An ethical issue with this type of research is that it can be considered unethical to remove an intervention helping with symptom management. Another ethical issue is that if a client is experiencing a crisis, it would not be helpful to ask the client to track behaviors/outcomes before engaging in an intervention.
Example of ABAB:
Structure: Single-subject research typically unfolds in two main phases:
-
Baseline Phase
-
This phase occurs before any intervention begins.
-
The goal is to observe and identify patterns in the client’s behavior (e.g., drinking more on weekends).
-
Ideally, data is collected in real time, but when that is not possible, retrospective self-reports may be used, though they are less reliable.
-
Since there’s no control group, the client’s behavior during this phase serves as the comparison point for measuring treatment effects.
-
-
Treatment Phase
-
Begins when the intervention is introduced.
-
Ongoing data collection helps determine whether the treatment is making a difference.
-
For instance, a social worker might track the number of alcoholic drinks consumed daily to see if there is a decrease in binge drinking.
-
Reference: DeCarlo, M. (2018). Scientific inquiry in social work (Adapted version). Open Social Work Education. https://scientificinquiryinsocialwork.com/
Unlike group research, which aggregates data from multiple participants and uses statistical analyses like means, standard deviations, and correlations to identify general trends, single-subject research emphasizes analyzing data from individuals. Rather than relying on inferential statistics, single-subject researchers primarily use visual inspection. This involves graphing a participant’s data and evaluating visual patterns to determine if the independent variable influenced the dependent variable.
When visually analyzing data, researchers consider several key elements:
-
Level: This refers to changes in the overall magnitude of the behavior or outcome when moving from one condition to another. A noticeable increase or decrease suggests an effect of the intervention.
-
Trend: This is the direction of change (e.g., upward or downward) in the dependent variable across time. A shift in trend, especially one that reverses direction after treatment, is a strong indicator that the intervention may be effective.
-
Latency: This is the time it takes for the behavior to begin changing after the intervention is introduced. A quick response suggests a likely link between the treatment and the observed change.
Overall, single-subject research relies on direct observation of patterns within an individual’s behavior to assess treatment impact, without using statistical generalization.
Reference: Price, P., Jhangiani, R., & Chiang, I. (2015). Research Methods of Psychology (2nd Canadian Edition). Retrieved from https://opentextbc.ca/researchmethods/
Data collection and analysis methods
Quantitative Methods:
-
Structured surveys and questionnaires.
-
Standardized assessment tools.
-
Numerical, measurable outcomes.
Qualitative Methods:
-
Interviews (open-ended).
-
Focus groups, case notes.
-
Rich, descriptive client narratives.
Mixed Methods:
-
Combines qualitative + quantitative approaches.
-
Offers both depth and measurable insight.
| Feature | Quantitative Research | Qualitative Research |
|---|---|---|
| Purpose | Measures and quantifies variables | Explores meaning, experiences, and perspectives |
| Data Type | Numeric (e.g., scores, percentages, frequencies) | Textual or visual (e.g., interview transcripts, observations) |
| Approach | Deductive (tests hypotheses or theories) | Inductive (builds theories from data) |
| Methods | Surveys, experiments, standardized assessments | Interviews, focus groups, case studies, participant observation |
| Data Analysis | Statistical techniques (e.g., averages, correlations, regressions) | Thematic coding, narrative analysis, grounded theory |
| Sample Size | Larger samples for generalizability | Smaller, purposive samples for depth |
| Outcome | Generalizable findings, often used in evaluations | In-depth understanding of context and meaning |
| Common Uses in Social Work | Program evaluation, needs assessments, prevalence studies | Understanding client experiences, developing interventions |
| Examples of Questions | “How many clients dropped out of treatment in 6 months?” | “How do clients describe their experience in therapy?” |
Quantitative research is often linked to objectivity and measurement, while qualitative research is linked to subjectivity and exploration. The ASWB exam may ask you to choose the best method for a particular practice scenario or client population. There should also be more than one person involved in coding interviews and developing themes.
Exploring Real-World Application
The following example is fictitious and not based on a real social worker.
Meet Jasmine. She is a licensed social worker at a community mental health clinic that serves young adults dealing with anxiety and depression. Over the past year, Jasmine noticed something: clients who attended the new mindfulness group seemed to stick with therapy longer than those who did not. Curious and committed to ethical practice, Jasmine decides to explore this pattern further, not just to satisfy her own curiosity, but to support her clients and her team.
Step 1: Identifying the Research Question: Jasmine frames a simple question: Does participating in the mindfulness group improve client retention in therapy?
Step 2: Choosing a Research Design: Since she cannot randomly assign clients to groups (that would not be ethical), she chooses a quasi-experimental design. She compares outcomes between those who chose to attend the mindfulness group and those who did not.
Step 3: Collecting Data: She pulls attendance records and client progress notes. She also sends out a short survey to measure clients’ self-reported stress levels. She codes the survey responses (e.g., “Very Stressed” = 5, “Not Stressed” = 1) and enters all the data into Excel.
Step 4: Analyzing the Data: Using descriptive statistics, Jasmine finds that mindfulness group members attended more sessions on average. With help from a colleague familiar with SPSS (statistical software used to edit and analyze data), she runs a t-test to compare session attendance between the two groups. Her p-value is 0.03, suggesting the difference is statistically significant.
What is p-value? The p-value tells you how likely it is that your results happened by chance.
-
A low p-value (like 0.03) means your findings are probably real, not just a fluke.
-
A high p-value (like 0.20) means your results might be random, not enough evidence to say something real is going on.
-
If p < 0.05, it is usually considered statistically significant.
-
It does not tell you how important the result I, just that it is unlikely due to luck.
Step 5: Adding Qualitative Insight: Wanting to go deeper, Jasmine also holds informal interviews with a few participants. She codes the transcripts with two of her co-workers and finds themes like “sense of community” and “feeling more in control.” These insights help explain why the group might be working.
Step 6: Sharing and Applying Findings: Jasmine shares her results in a team meeting. The findings support expanding the mindfulness group and tailoring intake to highlight it as an option. She even writes a short article for her agency’s newsletter.
qualitative data analysis
Qualitative analysis is all about making sense of words, patterns, and meaning. Whether reviewing interview transcripts, client journals, or case notes, the goal is to identify themes. For qualitative data, more than one person should always work together on coding to reduce the potential for bias. For instance, let’s say two social workers are reviewing interview transcripts from clients who participated in a community food program. One social worker highlights a quote that says, “I didn’t have to worry about groceries for once,” and labels it as relief from food insecurity. The other social worker reads the same quote and codes it as financial stress. They need to talk through their different interpretations to determine whether they need a broader theme. By working together, they help ensure the analysis reflects what clients actually meant, not just one person’s opinion.
Quick Breakdown
The following is a Cliff’s Notes version of qualitative data analysis:
-
Start with coding: Read through the data and highlight key phrases or ideas. These become codes. For example, in interviews with youth in foster care, a social worker might code phrases like “no one listens to me” or “felt safe here” as voice and safety.
-
Group codes into themes: Once several codes have been established, social workers can start to see bigger themes. For instance, maybe a lot of youth talked about needing more autonomy, so that becomes a theme like independence.
-
Interpret what it means: Go beyond surface-level to determine patterns. What’s consistent? What stands out? The goal is to make meaning from the data, while staying grounded in what participants actually said.
Examples of Qualitative Analysis:
| Method | What It Does |
|---|---|
| Grounded Theory | Builds new theories directly from the data—ideal when little prior research exists |
| Narrative Analysis | Examines how people tell their stories to understand identity and meaning |
| Content Analysis | Counts how often certain themes or topics appear—adds structure to open-ended data |
Qualitative researchers focus on trustworthiness, not just validity.
-
Credibility: Are the findings believable? Did they check with participants or use peer review?
-
Dependability: Would others see what they see if they looked at the data?
-
Confirmability: Can someone trace their conclusions back to the original data?
ASWB Exam: You may be asked how qualitative researchers analyze data (hint: look for terms like themes, coding, or trustworthiness). Also, remember that qualitative analysis is especially helpful for exploring lived experiences, complex issues, and marginalized perspectives.
-
Know the purpose: Qualitative research explores experiences, meanings, and perspectives—not numbers.
-
Watch for keywords: Terms like themes, coding, interviews, or trustworthiness often signal a qualitative approach.
-
Understand when to use it: Best for open-ended questions or when exploring new or complex issues.
-
Trustworthiness matters: Look for references to credibility, dependability, confirmability, or reflexivity.
Quantitative data analysis
Descriptive and inferential statistics are both types of quantitative analysis. Descriptive stats summarize the data, while inferential stats help test hypotheses and make predictions. In social work research and practice, statistics help professionals make sense of data.
Descriptive statistics are used to summarize and organize data so that patterns and trends can be easily understood. This type of analysis helps social workers describe what is happening within a client group or program.
Inferential statistics allow researchers to use data from a sample to make broader conclusions or predictions about a larger population. Inferential statistics help answer questions such as whether a treatment made a significant difference or if outcomes differ between groups. Both types of statistics are important in evidence-informed practice and are commonly seen in social work evaluations and assessments.
| Aspect | Descriptive Statistics | Inferential Statistics |
|---|---|---|
| Purpose | Summarizes and organizes data | Makes predictions or generalizations about a population |
| Focus | Describes what the data shows | Infers what the data means beyond the sample |
| Common Tools | Mean, median, mode, range, standard deviation | t-tests, chi-square tests, ANOVA, regression |
| Data Source | Based only on the observed (sample) data | Uses sample data to make inferences about a larger group |
| Example Use | “The average number of therapy sessions per client is 5.” | “There is a significant difference in dropout rates between groups.” |
| In Social Work | Used in case reviews, progress summaries, agency reports | Used in program evaluations, policy research, academic studies |
Common Types of Inferential Statistics
| Statistical Test | What It Does | When to Use It |
|---|---|---|
| t-Test | Compares the means of two groups | To see if a difference (e.g., between intervention and control) is statistically significant |
| ANOVA | Compares the means of three or more groups | To test if there are differences between multiple programs or service models |
| Chi-Square Test | Compares frequencies across categories to see if they are significantly different | Used with categorical data (e.g., gender and service outcomes) |
| Correlation | Measures the strength and direction of a relationship between two variables | To explore associations, like between age and number of sessions |
| Regression | Predicts the value of one variable based on another | To estimate outcomes or risk based on predictors like income or trauma history |
Univariate vs. Bivariate Analysis
Before diving into complex data, social work researchers can begin with univariate analysis to examine one variable at a time. This helps identify basic trends like averages or frequency. When the goal is to explore relationships between two variables, bivariate analysis is used. For example, checking whether stress levels are related to how often clients attend sessions. Both methods are used in practice and program evaluation.
| Type of Analysis | What It Involves | Purpose | Common Tools/Examples | In Social Work Practice |
|---|---|---|---|---|
| Univariate Analysis | Examines one variable at a time | Describes characteristics or patterns within a single variable | – Frequency distributions- Mean, median, mode- Range, standard deviation | Describing client demographics (e.g., average age), stress levels, or service usage |
| Bivariate Analysis | Examines two variables at the same time | Explores relationships, associations, or comparisons between variables | – Correlation- Cross-tabulation- Chi-square test | Testing if therapy attendance relates to symptom reduction, or comparing outcomes by gender |
Key Takeaway: Univariate analysis helps you understand what is happening with one variable. Bivariate analysis helps you understand how two variables relate to or influence each other.
ASWB Exam:
-
Focus on what the tool is used for and how it applies to social work practice.
-
You do not need to perform calculations, but you do need to choose the correct method in a scenario or interpret the purpose of a result.
-
Think real-world logic more than technical math.
Self-Check
methods to assess reliability and validity in social work research
Reliability refers to the consistency of a measurement tool. For example, if we measure alcoholism by asking individuals, “Have you ever had a problem with alcohol?” we might assume this would effectively identify those with alcohol use issues. However, responses may vary depending on context. An individual might answer “yes” after a night of heavy drinking, but “no” on a typical day (DeCarlo, 2018). These inconsistencies suggest that the measurement tool may not be reliable.
Memory is another common challenge in obtaining reliable data. When participants are asked to recall their past behaviors, the accuracy of their responses can vary. Asking someone to remember how much alcohol they consumed each day over the past three months may lead to errors unless they kept a detailed record. A more reliable method may be to ask how many drinks they had over the past week, as the shorter recall period is more manageable (DeCarloo, 2018). Even when observations are used rather than self-reporting, reliability can still be a concern. For instance, a researcher observing drinking behaviors in a bar may miss certain events, such as someone consuming multiple drinks while the researcher is temporarily away. The reliability of the observation depends on the researcher’s ability to consistently capture all relevant behaviors.
One way to assess reliability is through test-retest reliability, which examines whether a measure yields similar results over time. For example, if a student takes the SAT multiple times, the scores should be relatively stable. Likewise, a person with clinical depression should score similarly on a depression scale over a few days (DeCarlo, 2018).
Inter-rater reliability applies when multiple observers are involved. It reflects the degree to which different raters agree on their observations. For instance, when observing a parent interacting with a child, two raters should have similar evaluations of the interaction (DeCarlo, 2018). Discrepancies suggest lower inter-rater reliability.
Internal consistency reliability is relevant when using scales. The items should measure aspects of the same underlying concept. For example, a depression inventory like the Beck Depression Inventory (BDI) includes items on mood and pleasure. While these are not identical constructs, they are related, and their scores should correlate (DeCarlop, 2018). Cronbach’s Alpha is a statistical method used to evaluate internal consistency.
While reliability is about consistency in measurement, validity focuses on whether a tool or question truly measures what it is intended to measure. A measure can be consistent without being accurate; validity ensures that the results actually reflect the concept being studied. Validity is about accuracy.
| Type of Validity | Definition | Example |
|---|---|---|
| Face Validity | Does the measure look like it measures what it claims to? | A depression scale should include questions about mood, not unrelated topics like height. |
| Content Validity | Does the measure cover all relevant aspects of the concept? | Measuring healthy living with only gym visits ignores other factors like diet or sleep. |
| Predictive Validity | Can the measure accurately predict future outcomes related to the concept? | A healthy living scale that forecasts good blood test results later supports this validity. |
| Concurrent Validity | Does the measure correlate with another valid measure given at the same time? | A new depression scale shows similar results to the Beck Depression Inventory (BDI). |
| Convergent Validity | Does the measure produce results similar to other tools measuring the same concept? | Two different healthy lifestyle scales yield similar results. |
| Discriminant Validity | Does the measure not correlate with unrelated concepts? | A healthy living scale should not correlate with Italian language proficiency scores. |
Source of the following image (DeCarlo, Chapter 9, 2018):
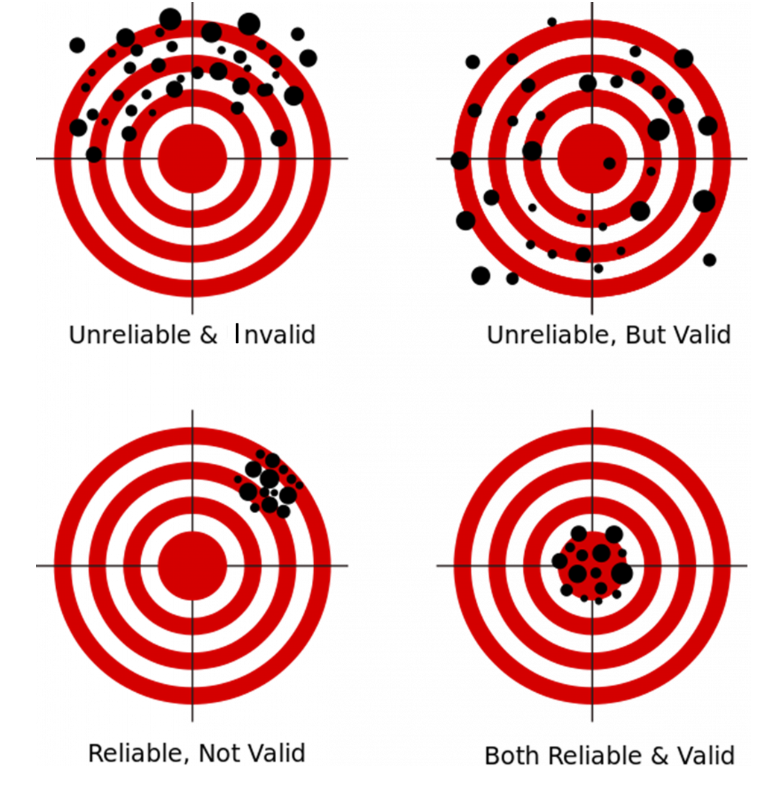
This image consists of four target diagrams arranged in a 2×2 grid. Each target uses black dots to represent individual data points (or measurements), and each is labeled to illustrate different combinations of reliability and validity:
-
Top Left: “Unreliable & Invalid”
The black dots are widely scattered across the target with no clear pattern and are not centered around the bullseye. This represents a measure that is neither consistent (unreliable) nor accurate (invalid). -
Top Right: “Unreliable, But Valid”
The black dots are also widely scattered, but they generally cluster around the bullseye in the center of the target. This represents a measure that is somewhat accurate (valid) but lacks consistency (unreliable). -
Bottom Left: “Reliable, Not Valid”
The black dots are tightly clustered together, but the cluster is off to one side of the target, away from the bullseye. This represents a measure that is consistent (reliable) but not accurate (invalid). -
Bottom Right: “Both Reliable & Valid”
The black dots are tightly clustered directly at the bullseye of the target. This represents the ideal measurement—both consistent (reliable) and accurate (valid).
evidence-based practice (EBP)
Definitions:
- EBP (noun): Prevention/treatment approaches that have been supported by multiple randomized clinical trials. For instance, these are interventions that have empirical evidence. Examples: Motivational interviewing for individuals with alcohol dependence; cognitive-behavioral therapy for individuals with depression; assertive community treatment for individuals with serious mental illnesses.
- EBP (verb): A process whereby clinicians consider the values and preferences of the client system, the best research available, and clinical practice expertise.
- Evidence-informed: A term used to denote the ever-evolving nature of evidence-based practice in social work. There are many research-supported interventions with varying client populations. Thus, the intervention we choose may not be the “best” or “most important” component. The term EI practice captures our evolving understanding of the science of social work practice.
The ASWB exam may include traditional questions about evidence-based practice (EBP), such as how social workers integrate research evidence with clinical expertise and client preferences. However, it is also important for social workers to critically examine the research itself, especially the sample used. For example, much of the research on bereavement interventions is based on non-diverse samples, often composed primarily of White, female participants. When applying EBP in practice, social workers must consider whether the evidence reflects the populations they serve and whether the intervention is culturally responsive and appropriate.
Three Pillars of EBP:
-
Best available research evidence
-
Clinical expertise
-
Client values and preferences
Steps of EBP Process:
-
Formulate a clear practice question.
-
Search for relevant research.
-
Critically appraise the evidence.
-
Integrate with client needs and clinical context.
-
Evaluate outcomes and adjust as needed.
Limitations of EBP
-
Some client needs may be under-researched or underrepresented
-
Relying solely on EBP without cultural context may unintentionally reinforce systemic bias
Ethical Considerations:
-
EBP is rooted in the NASW Code of Ethics, especially the principles of competence and client self-determination
-
Social workers must critically assess whether an intervention aligns with a client’s identity, values, and lived experience.
Real World Social Work Application
The following scenario is not based on a real social worker.
Tanya is a licensed social worker at a grief support center serving a diverse urban population. A new client, Amina, a 32-year-old Muslim woman whose father died three months ago, comes in for counseling. Tanya is trained in a particular grief therapy modality that has supportive evidence. As Tanya prepares to use the model, she reviews the research behind it. She notices that the original studies primarily involved older White women from suburban areas and lacked cultural or religious diversity in the participant samples. Tanya recognizes that some of these methods may not align with Amina’s spiritual or cultural beliefs around grief expression and mourning rituals. Tanya still draws from the core principles of the grief modality, like helping clients process the pain of loss and reconnect with life, but she integrates it flexibly, guided by Amina’s values and voice.
This scenario shows how EBP is not a “one-size-fits-all” tool. Social workers must balance research evidence with cultural responsiveness and clinical judgment.
Case recording for practice evaluation or supervision
Clinical documentation can be used to track client progress and also as a tool for consultation and supervisory review. It is important for social workers to consider “What Is It For” when writing documentation. Case notes should be objective, factual, timely, and professional. Good documentation includes client statements, observed behaviors, and actions taken by the social worker, without interpretation that could reflect bias or assumptions.
The NASW Code of Ethics notes the need for confidentiality and accurate recordkeeping. Social workers must maintain client records that are respectful and consistent with agency policy, while also considering how these records may be reviewed during audits, evaluations, or legal proceedings.
In supervision, case recording gives the opportunity for the supervisor to examine clinical reasoning, goal setting, and discuss ethical dilemmas. The exam may present situations where the social worker must choose how to use documentation in a supervision meeting. Look for responses that support professional development and ethical use.
From a macro perspective, documentation review is also relevant and contributes to quality assurance and organizational evaluation. The exam may test understanding of how well-kept records support outcome tracking, service improvement, and adherence to best practices.
Program evaluation
Evaluation is an essential process in the field of social work practice across all levels of practice (micro, mezzo, and macro). Program evaluation helps social workers and organizations assess whether their efforts are actually making a difference. Evaluation is not just about tracking activities, but it is also about measuring outcomes in a structured and intentional way. Before beginning any evaluation, it is important to clearly define what success looks like and how it will be measured.
Program evaluation helps social workers:
-
Demonstrate accountability to funders and communities.
-
Identify strengths and gaps in services.
-
Make data-informed decisions to improve outcomes.
-
Ensure that time and resources are used effectively.
It also aligns with the NASW Code of Ethics, which emphasizes competence, integrity, and evaluation of one’s own practice.
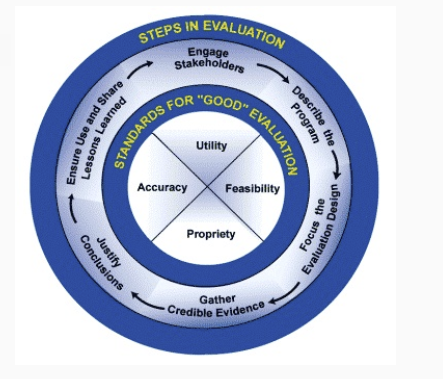
Steps in Evaluation:
- Engage Stakeholders
- Describe the Program
- Focus the Evaluation Design
- Gather Credible Evidence
- Justify Conclusions
- Ensure Use and Share Lessons Learned
Program Evaluation Examples:
- Needs assessment
- Outcome assessment
- Cost-benefit analysis
- Cost-effectiveness analysis
- Formative assessment
- Summative assessment
| Type of Evaluation | What It Focuses On | Purpose in Social Work |
|---|---|---|
| Needs Assessment | Identifies gaps in services or unmet community/client needs | Helps determine whether a program or intervention is needed |
| Outcome Assessment | Measures whether a program achieved its intended goals or client outcomes | Evaluates effectiveness based on changes in behavior, conditions, or status |
| Cost-Benefit Analysis | Compares the program’s financial costs to its economic or social benefits | Determines if the benefits outweigh the costs (in dollars or impact) |
| Cost-Effectiveness Analysis | Compares the cost of different interventions in relation to their outcomes | Helps choose the most efficient option for achieving desired outcomes |
| Formative Assessment | Conducted during program implementation to improve ongoing processes | Guides adjustments and improvements while the program is still running |
| Summative Assessment | Conducted after the program ends to assess overall impact or value | Provides a final judgment on whether the program was successful and met its objectives |
Information Needed for Different Types of Program Evaluations:
Note: Click the dropdown menus to read the content.
Self-Check
research ethics
Social workers must consider the potential consequences of research and follow professional ethical guidelines. When conducting research, they should consult institutional review boards (IRBs) to ensure ethical compliance. Social workers should ensure access to supportive services and avoid causing any harm, distress, or deprivation.
An essential issue to remember about research ethics is the importance of informed consent. Informed consent should include the nature, purpose, duration, risks, and benefits of participation. The standard is to obtain written consent from research participants and to explicitly state that their participation is voluntary and that they can withdraw at any time. Consider the importance of assent, even if the client’s legal guardian/proxy has signed written consent. Social workers should still seek assent from the client. Confidentiality and anonymity should be upheld, and any limits must be clearly explained. Identifying information must not be shared without explicit permission.
When using technology for research or evaluation, social workers must ensure participants understand and consent to its use, offering alternatives if needed.
Quick Breakdown
-
Always think participant safety and consent first. If a research method puts people at risk or skips consent, it is likely unethical.
-
Informed consent must be clear, voluntary, and respectful of the participant’s rights, capacity, and privacy.
-
Accurate reporting, confidentiality, and conflict of interest transparency are required.
- Avoid dual relationships or conflicts of interest with participants
- If a question involves research or evaluation with vulnerable clients, tech tools, or unexpected findings, think IRB, informed consent, confidentiality, and client protection first.
self-check
