7 Focal Spot Size
The four radiographic qualities introduced in Ch. 4 are brightness, contrast, spatial resolution and distortion. We also need to emphasize image receptor exposure, as it plays a big role in overall image quality. In this chapter, we will examine Focal Spot Size and how it impacts spatial resolution.
Learning Objectives
At the end of this chapter, you should be able to:
- Identify terms synonymous with focal spot.
- Differentiate between effective focal spot, actual focal spot and focal track.
- Explain how filament selection impacts effective focal spot size.
- Explain the line-focus principle.
- Explain how target angle impacts effective focal spot size.
- Explain the relationship of the anode-heel effect to focal spot size.
- Describe the conditions under which the anode-heel effect becomes most evident.
- Explain how to position a patient to best use the anode-heel effect.
- Define recorded detail.
- Differentiate between recorded detail, spatial resolution and visibility of detail.
- Define the terms penumbra and edge gradient.
- Explain how recorded detail is affected when unsharpness changes.
- Explain the effect of a change in focal spot size on unsharpness and recorded detail.
- Explain the effect of focal spot size changes on IR exposure, contrast and distortion.
The Anode
We learned in Ch. 1 that the anode is the positively charged electrode in the x-ray tube and its positive charge is responsible for accelerating the electrons from the filament to the target of the anode. We also learned that the target of the anode is made of Tungsten. Tungsten is chosen as the target surface because it has a high melting point (less likely to pit, or have holes melted into the surface, during an exposure), a high atomic number (greater efficiency of x-ray production because there are more inner shell electrons to interact with and a greater positive charge in the nucleus), and high heat-conducting ability (less likely to be damaged by heat over time). While x-ray tubes initially had stationary targets, the development of rotating anodes allows the heat produced at the focal spot to be spread out along the focal track, extending the life of the tube, and virtually all x-ray tubes now use rotating anodes.
Let’s look a little closer at the structure of the anode disk. The area of the anode where the electrons interact to create x-rays is called by multiple names including: the target, the focus, the focal point, and the focal spot. All of these refer to the precise point at which x-rays are created, and it is from this point that we measure the SID and SOD. In this book, we will use the term focal spot.
The Focal Spot
The term focal spot is used to describe the area on the anode from which the x-rays are emitted, but the term focal spot can also be used to describe the source of the x-ray photons from the viewpoint of the image receptor. This can be somewhat confusing for students. We can distinguish between these two uses of the term by adding “actual” or “effective” to the term. See Figure 7-1. The actual focal spot describes the physical area of the focal track that is impacted by the electrons. The effective focal spot is the area of the focal spot that is projected toward the object being imaged and the image receptor. Because the edge of the anode where the electrons interact is beveled, or angled, the effective focal spot is always smaller than the actual focal spot.
Figure 7-1: Focal Spot
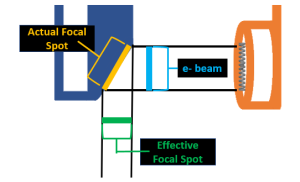
The actual focal spot is always larger than the effective focal spot because of the angle or bevel of the anode face.
The Anode Bevel
The anode bevel is the angle of the anode surface in relationship to a vertical line drawn perpendicular to the electron beam traveling from the filament to the anode. The degree of angulation of the anode bevel affects the relative size of the effective focal spot and the relative distribution of the intensity of the x-rays within the beam. See Figure 7-2.
Figure 7-2: Anode Bevel
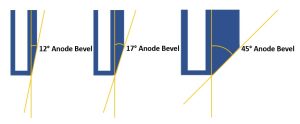
The angle of the anode bevel is measured in relationship to a perpendicular line. The degree of angulation of the bevel will affect the size of the effective focal spot and the variation of receptor exposure across the detector.
Typical anode angles range from 7° to 17°, however 12° target angles are the most common. Some tubes have filaments that are offset from one another allowing each filament to use a separate focal track and have a different degree of target angle.
Line Focus Principle
The size of the effective focal spot is controlled by the width of the electron beam and the angle of the anode bevel. The width of the electron beam is determined by the size of the filament selected for the exposure. The selection of the large or small focal spot setting on the control panel will determine whether a large or small beam of electrons is produced. The beam of electrons will be much wider than the projected effective focal spot. See Figure 7-3.
Figure 7-3: Effect of Filament Selection on Effective Focal Spot Size
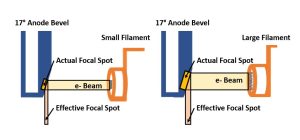
Smaller filaments produce smaller electron beams and smaller actual and effective focal spots. Larger filaments produce larger electron beams and larger actual and effective focal spots.
A smaller effective focal spot is preferred because it will improve recorded detail. In addition to selecting a smaller filament, we can create a smaller effective focal spot by changing the angle of the anode bevel. To create a smaller effective focal spot by changing the angle of the anode bevel, we will be applying the line-focus principle.
The line-focus principle tells us that a steeper anode angle will reduce the size of the effective focal spot while an anode angle greater than 45° will increase the size of the effective focal spot in comparison to the width of the electron beam. Application of the line-focus principle allows us to obtain the best possible resolution while spreading out the heat created by the electron interactions on a larger portion of the anode surface. See Figure 7-4.
Figure 7-4: Effect of Target Angle on Effective Focal Spot Size
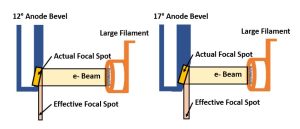
Steeper anode angles result in smaller effective focal spots.
When the angle of the anode becomes more parallel to the central ray, the effective focal spot gets smaller. Typical effective focal spot sizes in diagnostic x-ray tubes are 0.1 – 3 mm, with most tubes having a 0.6 mm small focal spot and a 1.2 mm large focal spot. Tubes that have focal spots that are smaller than 1 mm are often described as having a fractional focal spot, i.e. a focal spot that is a fraction of a millimeter in size. This term is particularly important in mammography equipment where microcalcifications are a significant indicator of malignancy. Since we cannot resolve structures smaller than the focal spot, mammography tubes typically employ a 0.3 mm large focal spot and a 0.1 mm small focal spot.
Key Takeaways
The effective focal spot size is determined by the size of the filament selected and the angle of the target bevel.
- Smaller filaments produce smaller effective focal spots. Larger filaments produce larger effective focal spots.
- Target bevels closer to vertical (0°) create smaller effective focal spots. Target bevels closer to parallel (90°) will produce larger effective focal spots.
If a smaller focal spot is better, and steeper target angles create smaller focal spots, why don’t we use a 0° or 1° target angle? As with many factors in the selection of radiographic techniques, the smaller effective focal spot produced by the target angle must be balanced with the variation in exposure across the image receptor caused by the anode-heel effect.
Activity 7A – Focal Spot Size
Anode-Heel Effect
The anode-heel effect is a variation in x-ray intensity along the length of the x-ray tube caused by absorption of x-ray photons by the anode. We know that tungsten has a high atomic number and, while that makes it a good target for the production of x-rays, it also makes it a good absorber of x-rays. Let’s take another close look at the anode. See Figure 7-5.
Figure 7-5: Anode-Heel Effect
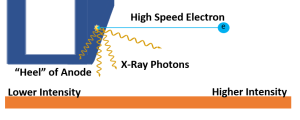
For any given point inside the anode, x-rays produced from interactions by the high speed electrons can be emitted in any direction. X-rays that exit in a direction perpendicular to the anode surface travel through less material than the x-rays that exit straight down or toward the anode end of the tube.
The direction the x-ray travels when it is emitted from the anode affects its probability of reaching the image receptor. When x-rays leave the site of the electron interaction in a direction that is perpendicular to the surface of the anode, they travel through the least possible thickness of metal. X-rays that exit the site of interaction in a direction toward the anode end of the x-ray tube travel through a much thicker amount of metal and are much more likely to be absorbed before leaving the anode. This means that the x-ray intensity is greater on the side of the image receptor positioned under the cathode and lower on the end under the anode.
Key Takeaways
IR exposure varies across the length of the IR due to the anode-heel effect.
- Exposure is higher on the cathode side of the image, because x-rays reaching this side of the IR travel through less metal.
- Exposure is lower on the anode side of the image, because x-rays reaching this side of the IR travel through more metal and are more likely to be absorbed before leaving the tube.
Steeper target angles create a greater amount of anode-heel effect. The degree of absorption that occurs can even limit the maximum field size that an x-ray beam can cover. For example, at a 40 inch SID, the maximum distance that can be covered by a beam emitted from a 12° target is 17 inches. This is the reason image receptors are built in 17-inch dimensions. Anode-heel effect becomes most apparent when a short SID and a large IR size are employed.
Using the Anode-Heel Effect
The anode-heel effect can be used to our advantage. When imaging body parts that have a thick end and a thin end, the anode-heel effect can be used to even out the exposure across the part. To do this, align the long axis of the part with the length of the x-ray tube. This is pretty easy because the x-ray tube is typically oriented along the length of the x-ray table and our long body parts of unequal thicknesses (like the femur, foot or humerus) also typically align parallel to the length of the table. The second step is a little trickier. Make sure the cathode end of the x-ray tube is over the thicker side of the body part. To verify which end of the tube is the cathode and which end is the anode, look for + and – markings on the tube housing near the electrodes. See Figure 7-6. To remember which end of the tube goes where, remember the saying “Fat Cat” – the fat end of the body part goes under the cathode end of the tube. This may require having the patient place their head at the opposite end of the table from your standard imaging practice.
Figure 7-6: Identifying the Anode and Cathode on the Tube Housing
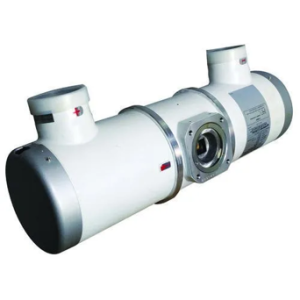
The electrodes powering each side of the x-ray tube will be marked on the tube housing. The minus sign (-) indicates the cathode and the plus sign (+) indicates the anode.
Recorded Detail
Recorded detail is the sharpness of the lines of the image. If the lines are recorded as sharp, the radiograph has good recorded detail. Poor recorded detail is seen as a fuzzy or blurry edge around the lines.
Key Takeaways
The factors that influence recorded detail affect the whole image. All the lines that form the image are affected equally by the factors influencing recorded detail. The factors can’t selectively affect one part of the image and leave the other parts unaffected unless the image has shape distortion. However, seeing the effect of poor recorded detail on the radiograph is sometimes difficult.
When thinking about the lines of the image, do not think just of the outside edges of the body part. Each image has internal lines that appear on a radiograph and those must be sharp also. When radiographing the skull, the image of the sella turcica must be sharp, the edges of the orbits must be sharp, and the image of the bony markings in the skull must be sharp. Looking at the edges of an internal bony structure on a radiograph is the best area to detect poor recorded detail.
recorded detail vs Spatial Resolution
A term related to recorded detail is spatial resolution. Spatial resolution is the ability of an imaging system to record two adjacent structures as separate and distinct structures. The term “imaging system” means the equipment that was used to form the image. If two very small adjacent structures are seen as two separate individual images on the radiograph, the radiograph has good spatial resolution. If it has good spatial resolution the image will also have good recorded detail. If the lines in the image are fuzzy or blurry due to low recorded detail, it will be difficult to distinguish two small structures as separate instead of being one bigger fuzzy blob, giving the image low spatial resolution.
Key Takeaways
Since it is sometimes difficult to see poor spatial resolution on a radiograph unless it is obvious, a special device called a resolution test tool is used to measure spatial resolution. See Figure 7-7 for a few examples. Resolution test tools are available in various spatial frequency ranges and in different steps depending on the aspect of the imaging system being tested. The resolution of digital imaging systems should be tested in at least 2 directions, although a special form of the resolution test called a Besom test tool may be used. The Besom test tool has continuously varying spatial frequency . This series of lines that get progressively closer together helps avoid falsely high readings.
Figure 7-7: Resolution Test Tool
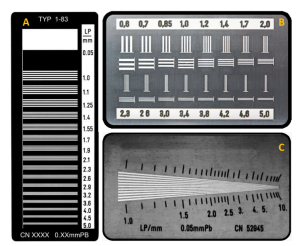
Type A is a standard resolution test tool that measures resolution in a single direction. Type B measures spatial resolution in two directions, at right angles to each other. Type C is a special type of resolution test tool called a Besom test tool.
A radiograph is taken of the resolution test tool using the same conditions used for a standard radiograph of a small part. Poor recorded detail can be seen more easily on the image of a resolution test tool than on an image of a patient.
The resolution test tools are flat pieces of metal with slits cut into it. The slits, called spaces, are interlaced with the metal lines of the tool. One metal line and the slit or space next to it is called a line pair. The resolution test tool is constructed to have a variety of sets of line pairs, each having different sizes. A number is usually written on the resolution tool next to each set of line pairs indicating how many line pairs in that set will fit into a millimeter. An area indicating five line pairs per millimeter would have smaller lines and spaces than an area indicating three line pairs per millimeter. The smaller line pairs are more difficult to make sharp or resolved on the radiograph.
The radiograph of the resolution test tool is examined with the eye to see the maximum number of line pairs per millimeter (LP/mm) that are resolved or seen as separate and sharp. An imaging system that produces good spatial resolution will show a large number of line pairs as sharp or well defined. This system will be able to display good recorded detail.
Key Takeaways
Spatial resolution and recorded detail are good when a large number of line pairs per millimeter are resolved.
Recorded Detail Vs Visibility of Detail
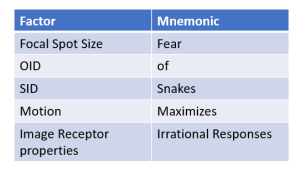
There are five factors that affect recorded detail. These are listed in Figure 7-8 along with a mnemonic to help you remember those factors. These are the only factors that affect recorded detail so it is important to remember them. I related the factors affecting recorded detail to fear of snakes because patients jumping out of their fear of snakes will definitely affect the recorded detail of your image!
Figure 7-8: Factors Affecting Recorded Detail
There are many factors that affect the visibility of detail. Visibility of detail is a term used by radiographers and radiologists to describe how well they can see the image. When a radiologist says that the detail on the image is not good, it could mean that the sharpness is inadequate, but it could also mean that the detail in the image is not visible due to issues with brightness, contrast or noise. It is important to recognize that visibility of detail and recorded detail are two distinct qualities.
Unsharpness Terms
All radiographs have some amount of unsharpness. When it can be seen with the eye, the radiograph has poor recorded detail. If a radiograph has poor recorded detail the lines in the image will have an area of unsharpness or a blurry area around them. There are several terms that described unsharpness and recorded detail.
The area of unsharpness can be called the penumbra. If the penumbra increases, the recorded detail decreases. You may also run across the term edge gradient. Edge gradient is synonymous with penumbra – the unsharpness of the edges of a structure. Both of those terms are somewhat outdated and more recent publications typically default to the term unsharpness. This book will use the term unsharpness. As unsharpness increases, recorded detail decreases.
Key Takeaways
Geometry and Recorded Detail
In geometry class, you learned about similar triangles. See Figure 7-9. With similar triangles, each corresponding angle has exactly the same degree, but the length of the lines in each triangle can be smaller or larger, making the size of the two triangles different.
Figure 7-9: Similar Triangles
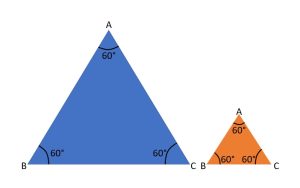
Two similar triangles. The size of the lines can change, but the degrees in each angle must remain the same.
The geometric factors that affect recorded detail are the size of the focal spot, the object-image receptor distance, and the source-image receptor distance. These factors can be arranged in a diagram to form similar triangles. Because the triangles are similar , if one of the geometric factors in the top triangle changes, the length of the line on the bottom triangle of the diagram that represents unsharpness will also change. If the unsharpness changes, the recorded detail on the radiograph changes. If the line representing the area of unsharpness increases, the recorded detail decreases. If the line representing the area of unsharpness decreases, the recorded detail increases.
Focal Spot Size
Try this experiment. Hold a finger up about one foot from your eyes. Cover one of your eyes with the other hand. Focus on an object beyond your finger and take particular notice of where your finger is in space compared to the object. Now cover your other eye with your hand. You should see a change in the relations hip of your finger and the object you were focusing on. This happens because each eye forms its own image of the finger and object. The human brain merges these two images and only sees one. A similar effect occurs on a radiograph, but the x-ray tube cannot merge the images and more than one image of the object is formed on the image receptor.
X-rays are produced at the focal spot. The focal spot is the area on the anode of the x-ray tube that is hit with electrons from the filament. All x-ray photons in a beam originate from the focal spot. Because the photons come from an area instead of from one single point, each photon in the beam forms its own image of the object.
Look at Figure 7-10. The photons (represented by the black lines) all originate from the focal spot, but the image of the object formed by each of the photons falls in a different spot on the image receptor. The image is spread out over this area on the image receptor and all of the separate image can make the whole image appear unsharp.
Figure 7-10: Geometry of Unsharpness

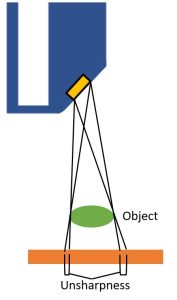
This diagram illustrates that larger focal spot sizes increase penumbral unsharpness. Each photon forms its own image of the object. Each of these separate images is projected to a slightly different spot on the image receptor. This spreads the image over an area on the image receptor and can make the image appear unsharp. Because the photons from a large focal spot come from a larger area, the area of unsharpness of the image is larger. When the photons are originate from a smaller area, the area of unsharpness of the image is smaller.
If the focal spot area is smaller, the image will be spread out less and will appear sharper on the radiograph. An image formed with a small focal spot will display better recorded detail because the photons originate from a smaller area. As the focal spot size increases, the area of unsharpness increases.
Key Takeaways
A Review of Image Properties
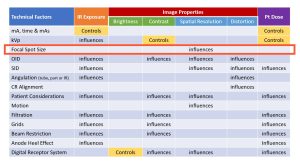
The focal spot size does not change the quantity of photons in the beam or the quality of those photons. That means that it does not affect IR exposure or contrast. The focal spot size does not change the orientation of the tube, patient and receptor, so it does not affect size or shape distortion. Because the focal spot size does not affect quality or quantity of the beam, this also means it does not affect patient dose. The ONLY thing focal spot size affects is recorded detail. See Figure 7-11.
Figure 7-11: Focal Spot Size’s Affect on IR Exposure, Image Properties and Patient Dose
Key Takeaways
The ONLY thing focal spot size affects is recorded detail.
Summary
- The line-focus principle tells us that steeper target angles create smaller effective focal spot sizes, increase the sharpness of the image and enable the visualization of smaller structures. A resulting disadvantage of using the line-focus principle is that the anode-heel effect may limit the field sizes that can be used.
- The anode-heel effect causes a reduction in x-ray intensity on the anode side of the image receptor due to absorption of x-rays by the metal of the anode.
- The anode heel effect is most evident with steeper anode angles, larger focal spots, shorter SIDs and longer field sizes.
- To use the anode-heel effect to best advantage:
- Use a short SID
- Use a large field size (i.e. keep the collimators all the way open in the lengthwise direction)
- Place the thicker end of the body part under the cathode end of the x-ray tube.
- Increasing the focal spot size results in more unsharpness or penumbra and the edges of a structure and therefore reduces recorded detail and spatial resolution.
- Focal spot size is the primary controlling factor of spatial resolution because the only thing focal spot size affects is recorded detail.
- Focal spot size does not affect IR exposure because it does not change the number of photons produced or their transmission through the body part.
- Focal spot size does not affect image contrast because it does not change the penetrability of the beam or the production of scatter.
- Focal spot size does not affect noise because noise is not related to geometry and focal spot changes are exclusively geometrical.
- Focal spot size does not affect distortion because it does not relate to alignment of the part and beam.
- The actual focal spot size must be within 50% of the size listed by the tube manufacturer.
- Objects smaller than the focal spot size will not be visible on the image.